Cumulative annualized yield since March 10, 2026. Data sourced on-chain. Past performance does not guarantee future results.
Higher Yield
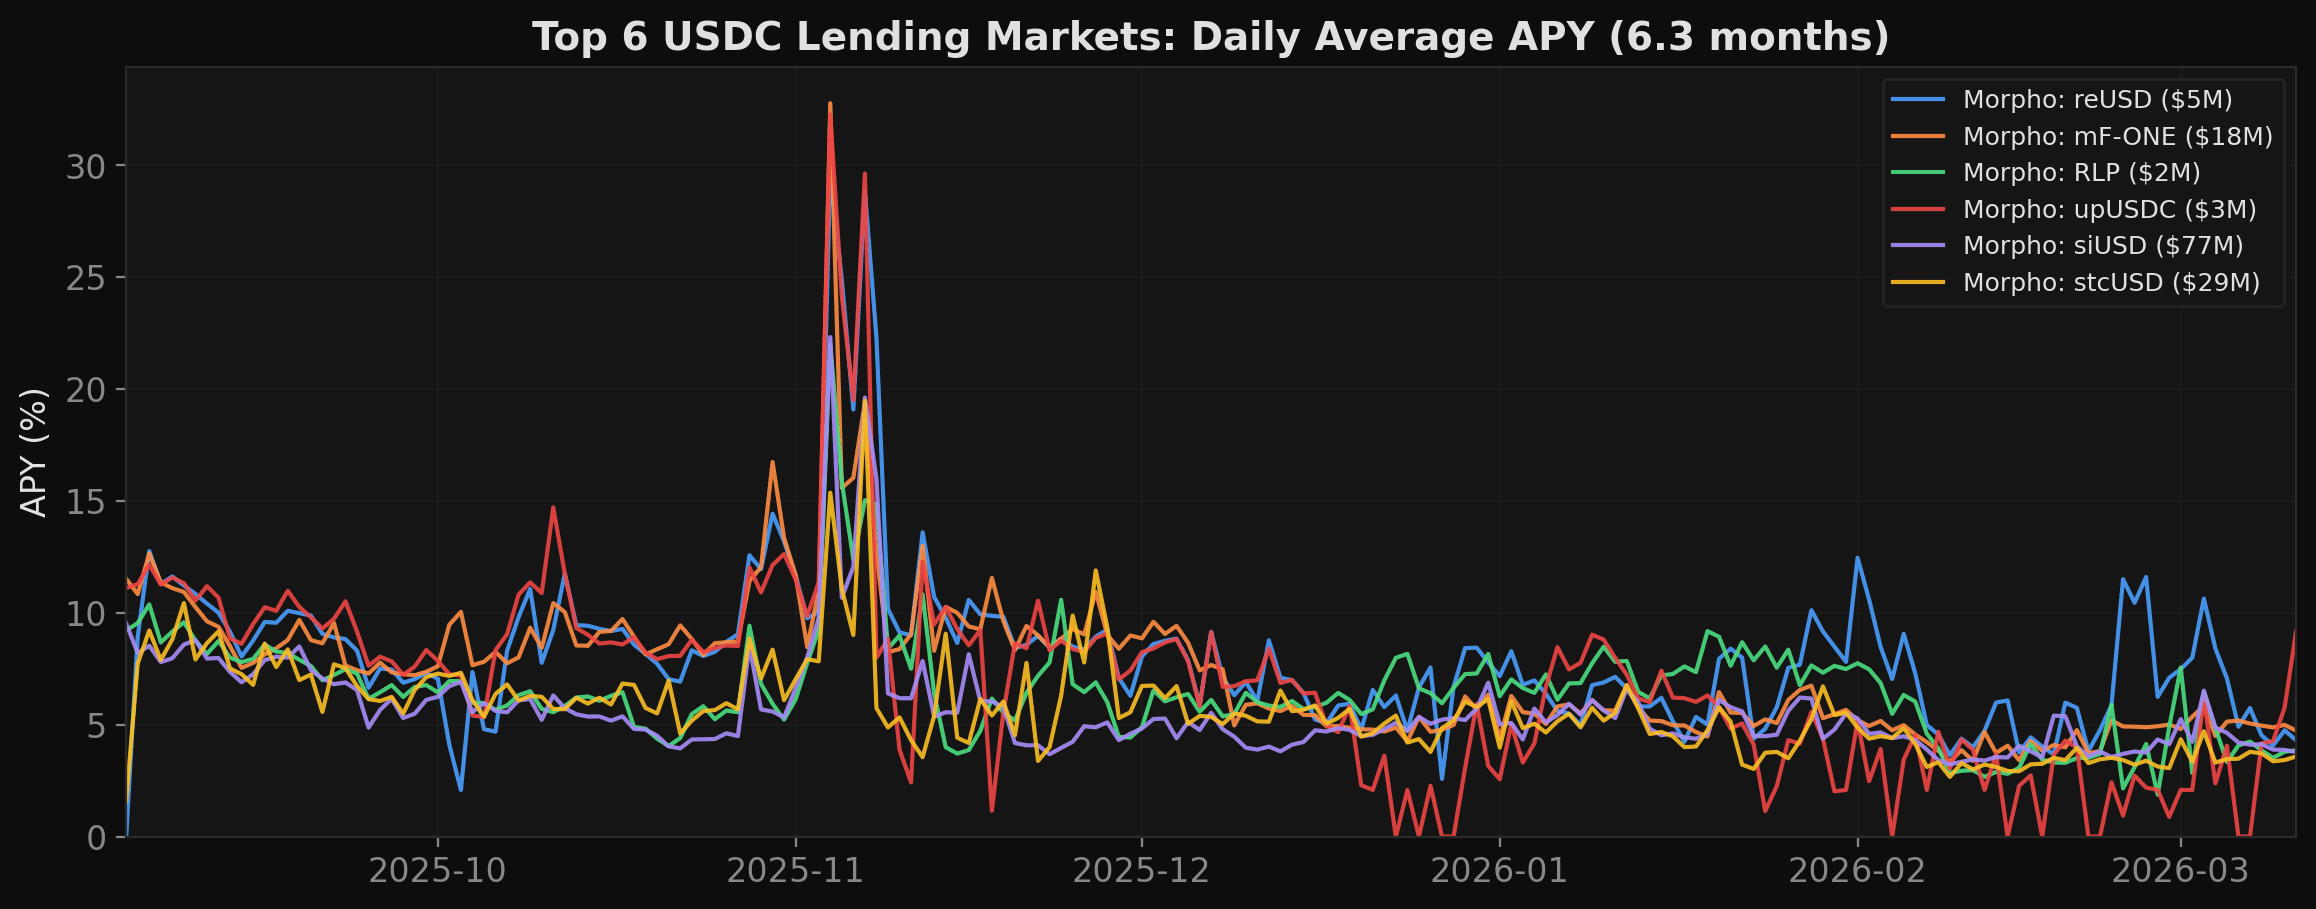
Tezoro has built a proprietary data ingestion & processing infrastructure and supports over 2,000 vaults and markets across Morpho, Euler, Fluid, Aave, Compound, Spark, and other protocols.
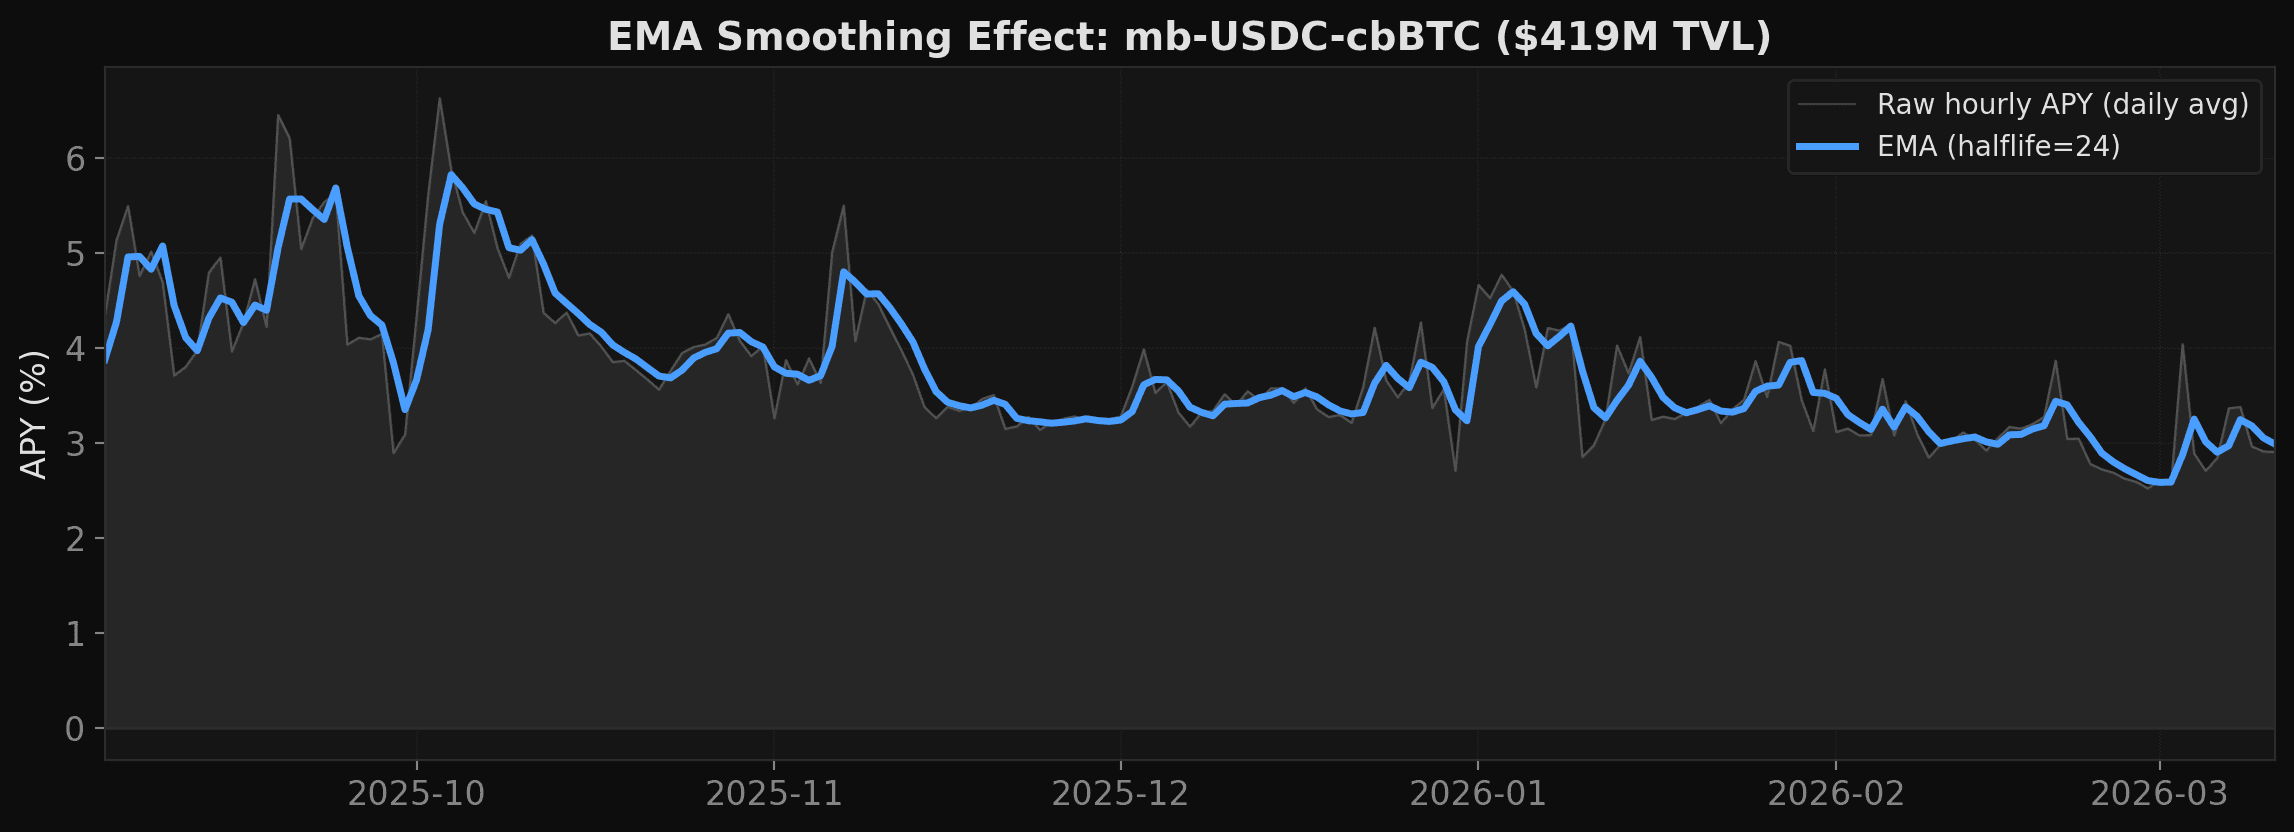
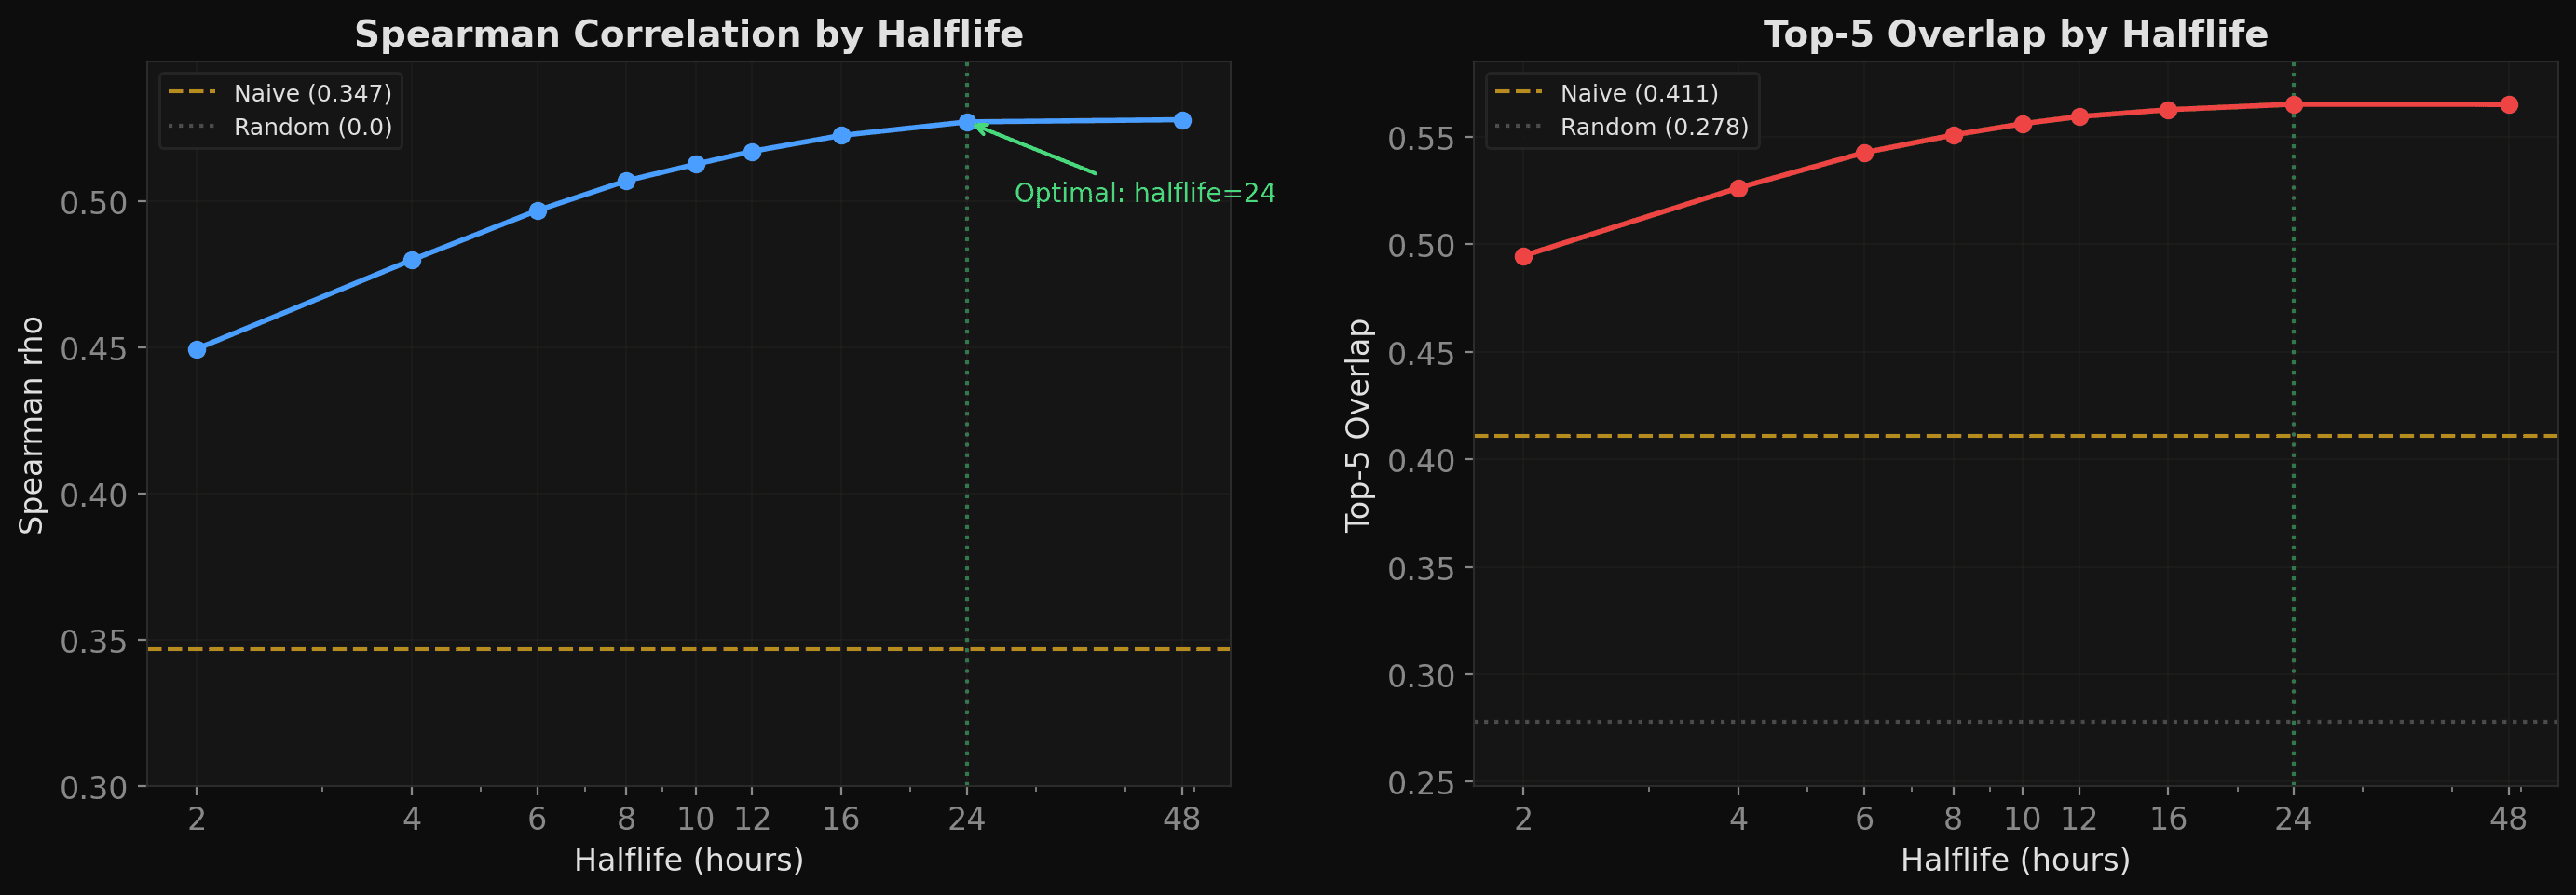
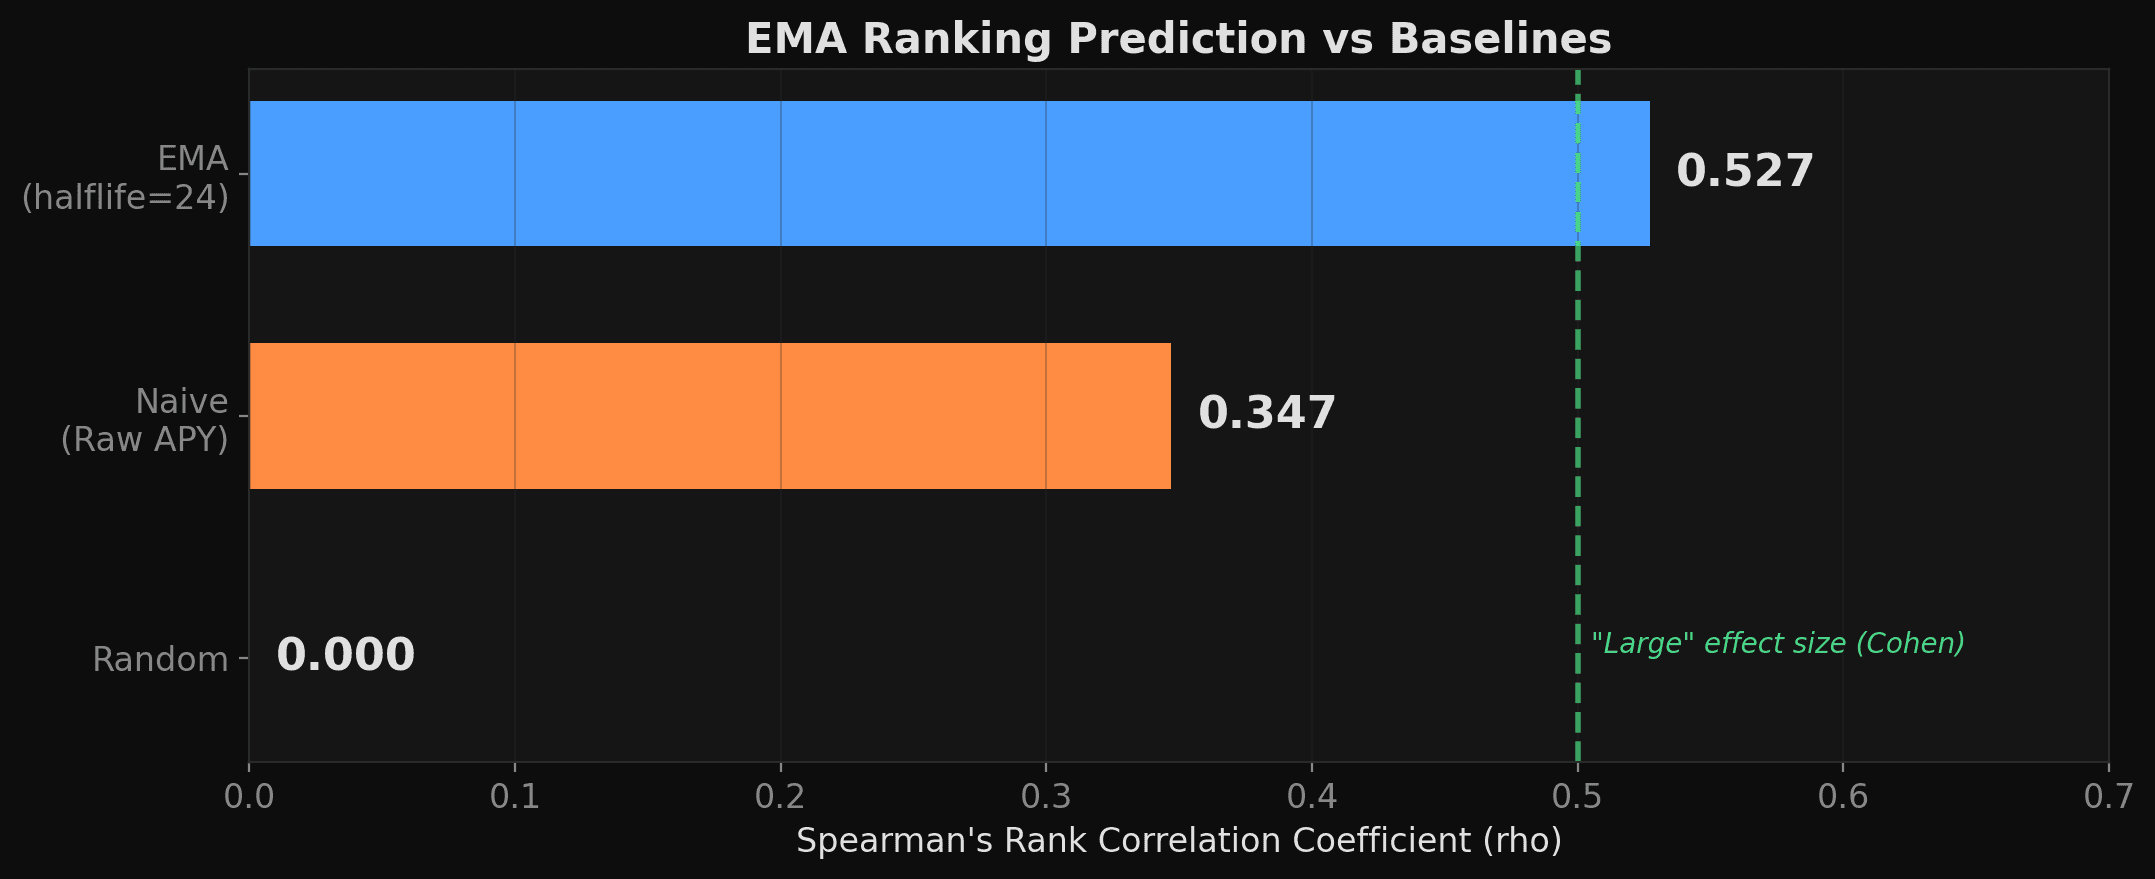
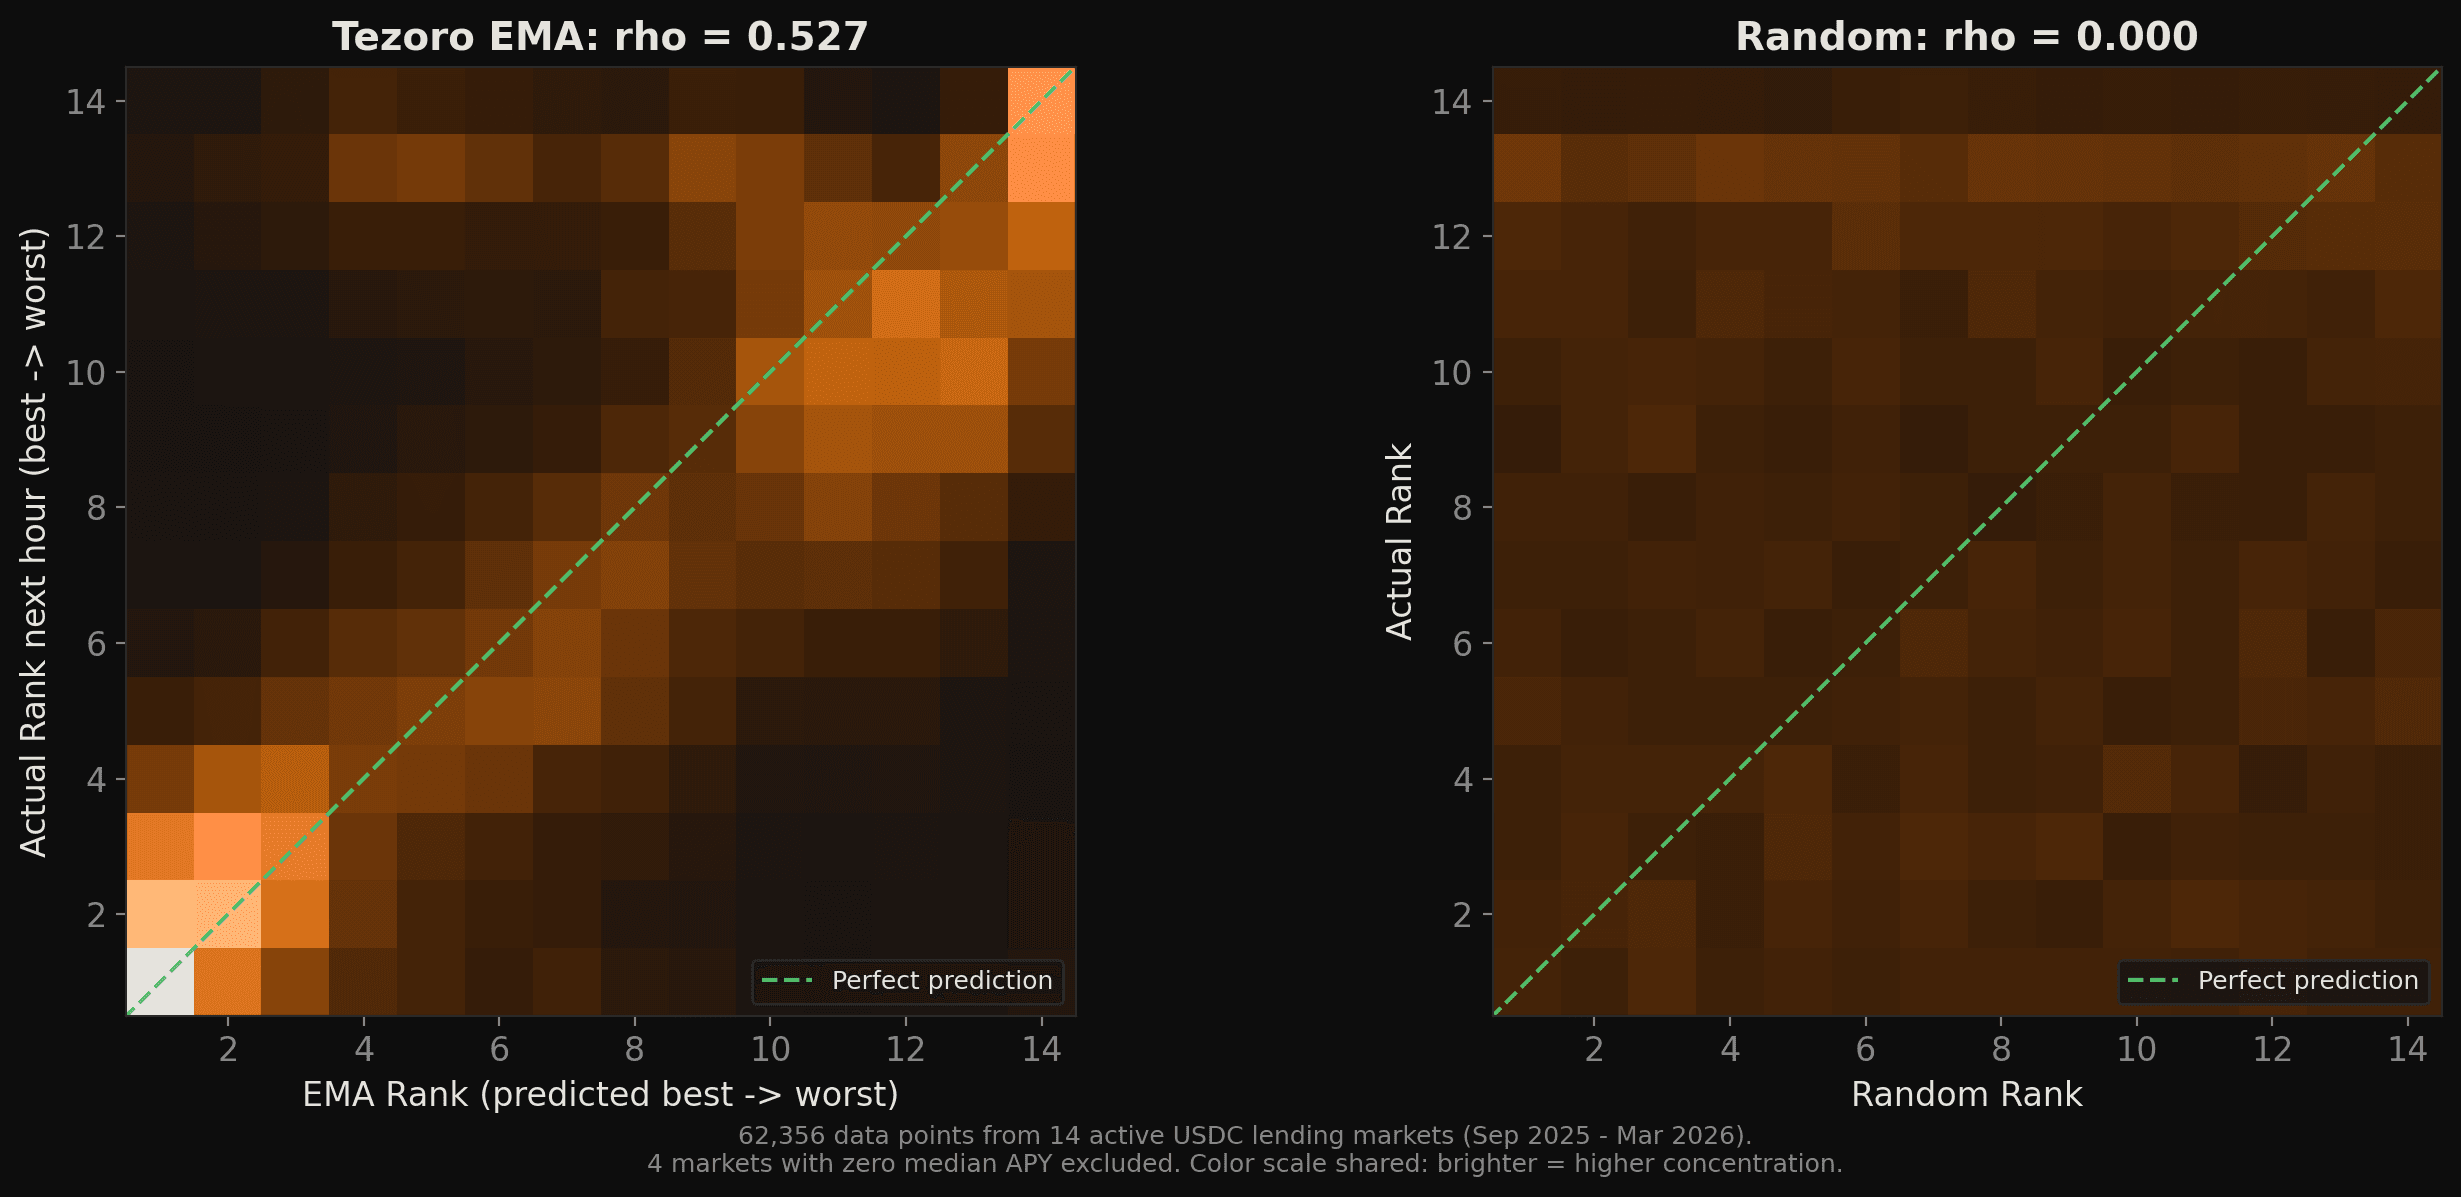
Tezoro uses Exponential Moving Average (EMA) to identify the most promising yield markets and allocate capital to the vaults and protocols most likely to deliver the highest future returns. The strategy was backtested and achieved a Spearman ρ of 0.527 — a top-quartile result within the theoretical [0,1] range, indicating a large effect size.
Tezoro rebalances your assets to keep them in top-yielding vaults, covers all rebalancing gas costs, and charges a 15% fee only on profits.
Tezoro not only compounds net yield, but also automatically claims rewards, swaps them into supplied assets, and reinvests them into the vault to maximize yield.
Cumulative annualized yield since March 10, 2026. Data sourced on-chain. Past performance does not guarantee future results.